OrgNice Chart Viewer is where you see the chart you have created! This is where everything comes together. The Chart Viewer is designed to be easy to use and navigate. It provides a number of capabilities. Let’s explore what you can do with Chart Viewer.
Understanding Chart Viewer
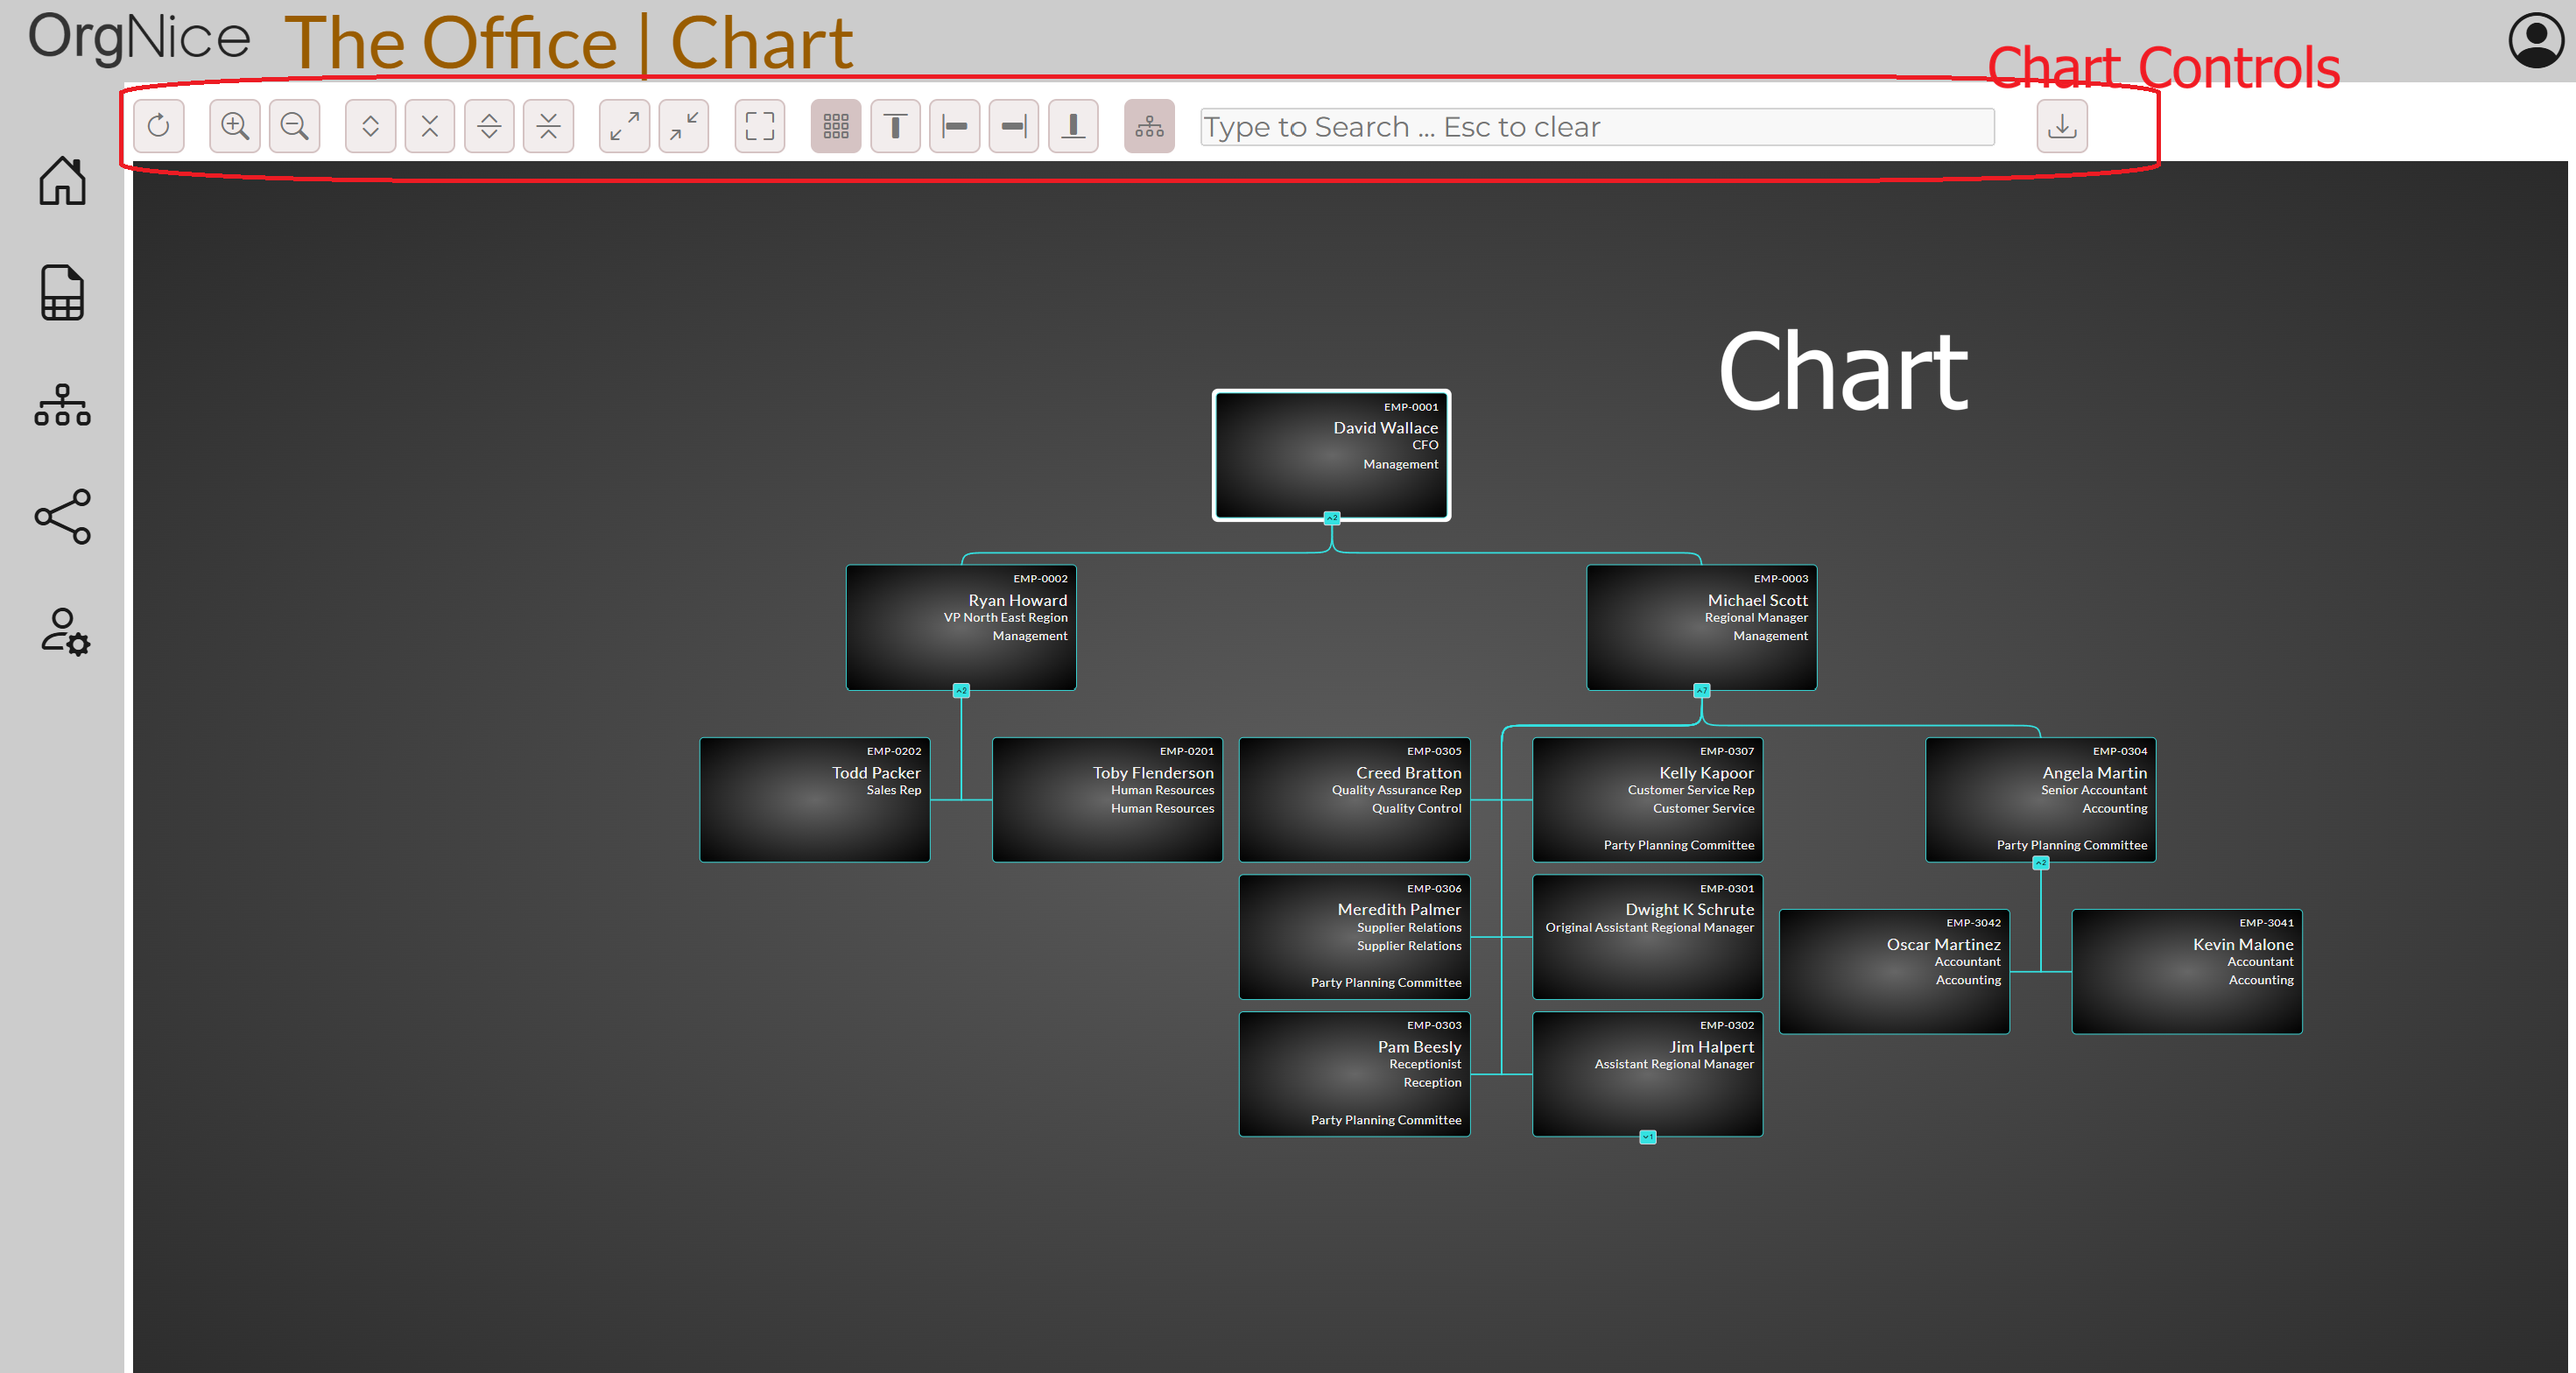
The key elements of the chart viewer are the chart itself and the chart controls.
Chart
Your Org chart occupies the most space in the Chart viewer. The primary navigation mechanism is using a mouse (or by touch if you are using a touch enabled screen).
Chart Navigation
- You can re-position the chart by dragging it around.
- Zoom in and out of the chart by pinch zooming. You can also use the zoom-in and zoom-out chart controls for it.
- Type on the chart to search by name. This will highlight nodes based on your settings in the chart controls.
- Lines shows how nodes are related to each other - parent and children in a hierarchy are connected. So managers are connected to their direct reports.
Node Interactions
- You can highlight and center a node by clicking on it. It will draw a highlight around the node and focus on the node (bring it to the center of the chart viewer). Click on it again to remove the highlight.
- You can expand and collapse the children of a node (the hierarchy) by clicking on the expander button at the bottom edge of any node. This way you can expand all the direct reports of a manager. The expander shows the number of direct children it has. If there are no children (i.e. no hierarchy below it), the expander is not visible.
Chart Controls
The chart controls are all laid out in the top button toolbar. Some controls may not be available based on your subscription tier. From left to right, the controls are -
- Refresh Refresh the chart. This will effectively redraw your chart.
- Zoom In Zoom in to the center of the chart to see more detail.
- Zoom Out Zoom out from the center of the chart to see more of the chart (reduce detail).
- Expand Expands all the nodes on the chart.
- Collapse Collapses all the nodes on the chart. You’ll be left with only the root node at the center. You can use this to reset the state and restart navigation.
- Expand Highlighted Expands the currently highlighted node (if any). Has no impact if there is no node highlighted
- Collapse Highlighted Collapses the currently highlighted node (if any). Has no impact if there is no node highlighted
- Fit To Screen Fits the current chart to screen so you can see the whole chart
- Center Highlighted Centers the highlighted node to the center of the screen
- Fullscreen Make your chart fullscreen - good to get more real-estate for your chart and for presentations
- Compact Mode Compact mode lays out your chart to make it consume less horizontal space when it is expanded. You can toggle this mode on or off.
- Layout Top to Bottom Set the layout strategy of the chart to be top to bottom
- Layout Left to Right Set the layout strategy of the chart to be left to right
- Layout Right to Left Set the layout strategy of the chart to be right to left
- Layout Bottom to Top Set the layout strategy of the chart to be bottom to top
- Highlight Path to Root if this option is ON, then when a note is highlighted, the path to the root of the chart is highlighted as well
- Layers Opens the Layers panel to toggle configured visual layers on and off. Visual layers allow you to color-code and style nodes based on your spreadsheet data. See Layers for more information on configuring layers.
- Search You can type to search. The search text shows up here. You can press Escape to clear.
- Export Export the current state of the chart as PNG, SVG or PDF. You can expand your chart to the desired state and then export it to retain that state as a snapsot. If you want the whole chart, you can Expand all nodes first and then export.